Paris, June 21, 2009
The first complete map of global ammonia emissions has recently been achieved using to satellite data. It reveals an underestimation of some of the ammonia concentrations detected by current inventories, and identifies new hotspots. This work, carried out by a team from LATMOS-IPSL (CNRS/UPMC/UVSQ) in collaboration with Belgian researchers from the Université Libre de Bruxelles, was facilitated by the infrared measurements of the French IASI instrument, part of the MetOp meteorological satellite developed by CNES. These results were published online in Nature Geoscience on 21 June 2009.
Ammonia (NH3) contributes significantly to the formation of the particles that give rise to pollution episodes. It mainly emanates from the use of agricultural fertilizers and increasingly intensified livestock breeding practices. Ammonia is the least well-understood pollutant regulated by European Directives on air quality. Mapping of its emissions are imprecise and systematic global monitoring of this compound is difficult. Once emitted, ammonia only remains in the atmosphere for a short period but triggers a cascade of environmental effects. At a local level, high ammonia concentrations affect fauna, flora and air quality.
Although the IASI instrument (part of the MetOp meteorological satellite) was not initially intended to detect ammonia in the Earth's atmosphere, researchers developed a methodology that could isolate the signature of ammonia from its background signal. By filtering the data and accumulating them continuously over a one-year observation period (more than a million measurements per day, with two passes over each part of the globe), the scientists were able to generate maps of its concentrations and to compare them with recent atmospheric models.
This work has demonstrated an underestimation of the ammonia emissions supplied by current inventories in agricultural valleys of the northern hemisphere, and particularly in the USA (the regions of San Joaquin in California and Snake River Valley in Idaho) and Europe (the Po and Ebre valleys). The most marked differences were found in Central Asia, with the identification of some sources not mentioned in current inventories.
--------------------------------------------------------------------------------
© Image MODIS © L. Gonzalez/C. Deroo LOA; Image IASI © ULB & INSU-CNRS
Distribution of ammonia in 2008, measured using the IASI instrument on board the /MetOp satellite, superimposed on an image of Europe obtained on August 30, 2008 by MODIS. Yellow to red colors indicate regions with high ammonia concentrations. The white structures are clouds.
--------------------------------------------------------------------------------
--------------------------------------------------------------------------------
© CNES/Eumetsat
The MetOp satellite launched at the end of 2006. The IASI instrument is shown by an arrow.
--------------------------------------------------------------------------------
Notes:
1) Laboratoire atmosphères, milieux, observations spatiales (CNRS/UPMC/UVSQ), which forms part of Institut Pierre-Simon Laplace
2) The measurements available are local, occasional or even inexistent in some regions.
3) Interféromètre Atmosphérique de Sondage Infrarouge (Infrared Atmospheric Sounding Interferometer), an instrument constructed by CNES and launched on board the MetOp satellite at the end of 2006
4) The MetOp program is a CNES/Eumetsat partnership that for 15 years will generate continuous observations of the atmosphere's composition through the launch of three successive satellites.
References:
Global ammonia distribution derived from infrared satellite observations, Lieven Clarisse, Cathy Clerbaux, Frank Dentener, Daniel Hurtmans, Pierre-François Coheur, Nature Geoscience, online 21 June 2009.
II INTERNATIONAL SEMINAR: 18 TO 22 DE NOVEMBER 2009- PISCO - ICA - PERI.

NUEVO
martes, 28 de julio de 2009
viernes, 10 de julio de 2009
Plants may affect the effect of wildfires
LIVERMORE, Calif. – Rising temperatures may lead to more tinder-dry vegetation, but that doesn’t mean there will be a higher risk for wildfires in a particular area.
It all depends on the type of vegetation in the area.
A new study on the cover of the May issue of Ecological Monographs shows that, in some cases, the types of plants growing in an area could override the effects of climate change on wildfire occurrence.
Lawrence Livermore National Laboratory scientist Tom Brown along with Philip Higuera of Montana State University and colleagues looked at the direct and indirect impacts of millennial scale climate change on fire occurrence in the south-central Brooks Range in Alaska.
The team looked at historical fire occurrence by analyzing sediments found in the bottom of lakes.
Using the Lab’s Center for Accelerator Mass Spectrometry, they carbon dated the deposits in the sediment and reconstructed fire occurrences from 15,000 B.C. to the present. They then measured the amount of plant parts, such as fossil pollen, to figure out what type of vegetation dominated the area during the different time periods. Like rings in a tree, different layers of sediment represent different times in the past.
The conclusion: historical changes fire frequencies coincided with changes in the type of vegetation in the area, more so than to rising temperatures alone.
Although changing temperatures and moisture content set the stage for changes in wildfire frequency, they can often be trumped by changes in the distribution and abundance of plants.
Earlier studies have shown that the area burned across arctic and boreal regions will increase over the next century as climate change lengthens the fire season, decreases moisture and increases ignition rates. However, vegetation can alter the direct link between climate and fire by influencing the abundance, structure and moisture content of fuels across space and time, Brown said.
“There’s a complex relationship between fuels and climate,” he said. “Vegetation can have a profound impact on fire occurrences that are opposite or independent of climate’s direct influence on fire.”
In the recent study, the researchers found that changes in climate were less important than changes in vegetation. Despite a transition from a cool, dry climate to a warm, dry climate about 10,500 years ago, the researchers found a sharp decline in the frequency of fires. Their sediment cores from that time period revealed a vegetation change from flammable shrubs to fire-resistant deciduous trees.
The research implies that the impacts of climate change on modern-day fire frequencies could be strongly mediated by changes in vegetation. Thus, in some cases, the impacts of climate change on fire may be less intuitive than initially perceived.
“This could give fire managers a good indication that vegetation can substantially alter the direct effects of climate change on fire occurrence,” Brown said.
Other contributors include the University of Washington and the University of Illinois-Urbana.
miércoles, 1 de julio de 2009
NASA Satellite Detects Red Glow to Map Global Ocean Plant Health
05.28.09
This data-based map shows the "fluorescence yield" of phytoplankton in the oceans during 2004. "Fluorescence yield" is the fraction of absorbed sunlight that is given off by the plants as fluorescence and it changes with the health or stress of the phytoplankton. More fluorescence is emitted when waters are low in key nutrients such as iron. Credit: NASA's Scientific Visualization Studio
The MODIS instrument on NASA’s Aqua satellite compiled this global view of the amount of fluorescent light emitted by phytoplankton in the ocean. The amount of fluorescent light is not constant; it changes with the health of the plant life. Credit: Mike Behrenfeld, Oregon State University
Phytoplankton -- such as this colony of chaetoceros socialis -- naturally give off fluorescent light as they dissipate excess solar energy that they cannot consume through photosynthesis. Credit: Maria Vernet, Scripps Institution of Oceanography
› Larger image
This data-based map shows iron dust deposition on the oceans in spring 2004. Areas with low dust deposition have high fluorescence yields. Credit: NASA's Scientific Visualization Studio
› Larger image
Researchers have conducted the first global analysis of the health and productivity of ocean plants, as revealed by a unique signal detected by a NASA satellite. Ocean scientists can now remotely measure the amount of fluorescent red light emitted by ocean phytoplankton and assess how efficiently the microscopic plants are turning sunlight and nutrients into food through photosynthesis. They can also study how changes in the global environment alter these processes, which are at the center of the ocean food web.
Single-celled phytoplankton fuel nearly all ocean ecosystems, serving as the most basic food source for marine animals from zooplankton to fish to shellfish. In fact, phytoplankton account for half of all photosynthetic activity on Earth. The health of these marine plants affects commercial fisheries, the amount of carbon dioxide the ocean can absorb, and how the ocean responds to climate change.
“This is the first direct measurement of the health of the phytoplankton in the ocean,” said Michael Behrenfeld, a biologist who specializes in marine plants at the Oregon State University in Corvallis, Ore. “We have an important new tool for observing changes in phytoplankton every week, all over the planet.”
The findings were published this month in the journal Biogeosciences and presented at a news briefing on May 28.
Over the past two decades, scientists have employed various satellite sensors to measure the amount and distribution of the green pigment chlorophyll, an indicator of the amount of plant life in the ocean. But with the Moderate Resolution Imaging Spectroradiometer (MODIS) on NASA’s Aqua satellite, scientists have now observed “red-light fluorescence” over the open ocean.
“Chlorophyll gives us a picture of how much phytoplankton is present,” said Scott Doney, a marine chemist from the Woods Hole Oceanographic Institution and a co-author of the paper. “Fluorescence provides insight into how well they are functioning in the ecosystem.”
All plants absorb energy from the sun, typically more than they can consume through photosynthesis. The extra energy is mostly released as heat, but a small fraction is re-emitted as fluorescent light in red wavelengths. MODIS is the first instrument to observe this signal on a global scale.
“The amount of fluorescent light emitted is not constant; it changes with the health of the plant life in the ocean,” said Behrenfeld. “The challenge with global MODIS fluorescence data is to uncover the important biological information that is hidden in it.”
Red-light fluorescence reveals insights about the physiology of marine plants and the efficiency of photosynthesis, as different parts of the plant’s energy-harnessing machinery are activated based on the amount of light and nutrients available. For instance, the amount of fluorescence increases when phytoplankton are under stress from a lack of iron, a critical nutrient in seawater. When the water is iron-poor, phytoplankton emit more solar energy as fluorescence than when iron is sufficient.
The fluorescence data from MODIS gives scientists a tool that enables research to reveal where waters are iron-enriched or iron-limited, and to observe how changes in iron influence plankton. The iron needed for plant growth reaches the sea surface on winds blowing dust from deserts and other arid areas, and from upwelling currents near river plumes and islands.
The new analysis of MODIS data has allowed the research team to detect new regions of the ocean affected by iron deposition and depletion. The Indian Ocean was a particular surprise, as large portions of the ocean were seen to “light up” seasonally with changes in monsoon winds. In the summer, fall, and winter – particularly summer – significant southwesterly winds stir up ocean currents and bring more nutrients up from the depths for the phytoplankton. At the same time, the amount of iron-rich dust delivered by winds is reduced.
“On time-scales of weeks to months, we can use this data to track plankton responses to iron inputs from dust storms and the transport of iron-rich water from islands and continents,” said Doney. “Over years to decades, we can also detect long-term trends in climate change and other human perturbations to the ocean.”
Climate change could mean stronger winds pick up more dust and blow it to sea, or less intense winds leaving waters dust-free. Some regions will become drier and others wetter, changing the regions where dusty soils accumulate and get swept up into the air. Phytoplankton will reflect and react to these global changes.
“NASA satellites are powerful tools,” said Behrenfeld. “Huge portions of the ocean remain largely unsampled, so the satellite view is critical to seeing the big picture that complements the process-oriented understanding we get from work on ships and in laboratories.”
The research was funded by NASA and involved collaborators from the University of Maine, the University of California-Santa Barbara, the University of Southern Mississippi, NASA’s Goddard Space Flight Center, the Woods Hole Oceanographic Institution, Cornell University, and the University of California-Irvine.
‘Invasive aliens’ threaten global biodiversity
While the implications of climate change for biodiversity have been widely recognised, the insidious effect of invasive alien species (IAS) on global biodiversity stays under the radar.
22 May 2009
That is why this year’s theme for the United Nations’ International Day for Biological Diversity (IDB) on 22 May is IAS.
The International Convention on Biological Diversity sees IAS as “one of the greatest threats to biodiversity, and to the ecological and economic well-being of society and the planet”.
“All our efforts in managing the impact of climate change on biodiversity could be brought undone by invasive species,” CSIRO Biodiversity Research Director, Dr Mark Lonsdale said.
“All our efforts in managing the impact of climate change on biodiversity could be brought undone by invasive species,” CSIRO Biodiversity Research Director, Dr Mark Lonsdale said.“Increasing globalisation has led to greater movement of new species around the world, and native species killed or stressed by global change will all too often be replaced by these weeds and feral animals.
“Invasive species are already a major cause of biodiversity loss and we need new tools to tackle them.
“Because of this CSIRO is putting considerable resources into research on IAS and their effect on Australia’s biodiversity, as well as actively participating in international groups such as DIVERSITAS and the Global Invasive Species Programme.”
Current CSIRO research targets invasive species already in Australia as well as trying to anticipate and avert the next generation of IAS. The threats are diverse and hard to predict so excellence in risk-based research to make sense of the complexity is essential.
“Our research ranges from weeds, rabbits, carp and risk analysis of potential invasive species to biological collections that underpin much of the research,” Dr Lonsdale said.
“Our weeds research, for example, ranges from individual weeds such as lantana to the resistance of our ecosystems to weed invasion.”
The Australian National Herbarium, with its collection of native and exotic plants, underpins much of Australia’s weeds research and provides a vital resource when a new invasive plant species is found.
Dr Lonsdale stressed that invasive species are one of many direct threats to global biodiversity and, in Australia, CSIRO is responding to the magnitude of the challenge.
Download images at: 'Invasive aliens' threaten global biodiversity
Suscribirse a:
Entradas (Atom)

MILLENIUMNATURALEZA

for look in spanish
AS UNIVERSITY PROFESSOR
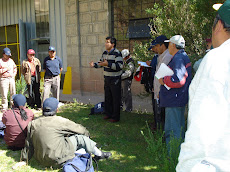
with students of master environment management (UNH)
Parana

Parana university (Curitiva-Brasil) February 2009
Huancayo

golden forest - Huancayo - Perú-(April 2009)
AS BUSINESSMAN

PROPRIETOR MANAGER OF MILLENIUM RADIO 106.9 FM
MILLENIUM RADIO 106.9 FM
VOICE AND FEELINGS AMAZONIAN, FROM LAMAS